


Peak Hours, Drop-Offs, and Wait Times: What Kiosk Analytics Can Tell UAE Businesses
Have you ever walked out of a queue in a Dubai mall because it simply refused to move? Most of us have. And the business behind that counter rarely knows we left.
Your self-service kiosk, though, sees everything. It records when customers arrive, how long they take and the exact screen where they give up.
In simple words, every tap is a data point. And those data points can tell you more about your customers than any guesswork.
So, what exactly can kiosk analytics reveal for UAE businesses? Kindly read on.
Why TIME is crucial to every business?
Your customers everywhere are running short on patience.
As per the survey conducted by Waitwhile, 84% of consumers will skip a business altogether if they expect to wait.
The willingness to wait in a physical line is reducing at a fast pace – the study claims. According to the latest research, the percentage of customers willing to wait 15 minutes has dropped from 81% to 75% over the past few years.
Nearly 40% of them go to a competitor or drop the purchase, if they were forced to deal with a physical lane.
Recent studies conducted by Facit Analytics claim that approximately 3 out of 4 customers would skip a purchase if their queue waiting time exceeded the crucial 5 minutes!
Five minutes. That’s all you get.
What is kiosk analytics?
In simple terms, kiosk analytics is the collection and analysis of crucial data about user interactions and kiosk performance.
This includes session start and end times, screen-by-screen navigation, payment success rates, hardware uptime, etc. Kiosk analytics data gives businesses and service providers a wealth of insights that facilitate proactive maintenance, stronger operational security, and a higher return on investment.
Without this crucial data, businesses might overlook several key issues related to kiosk performance and operations which could adversely affect the deployment outcomes.
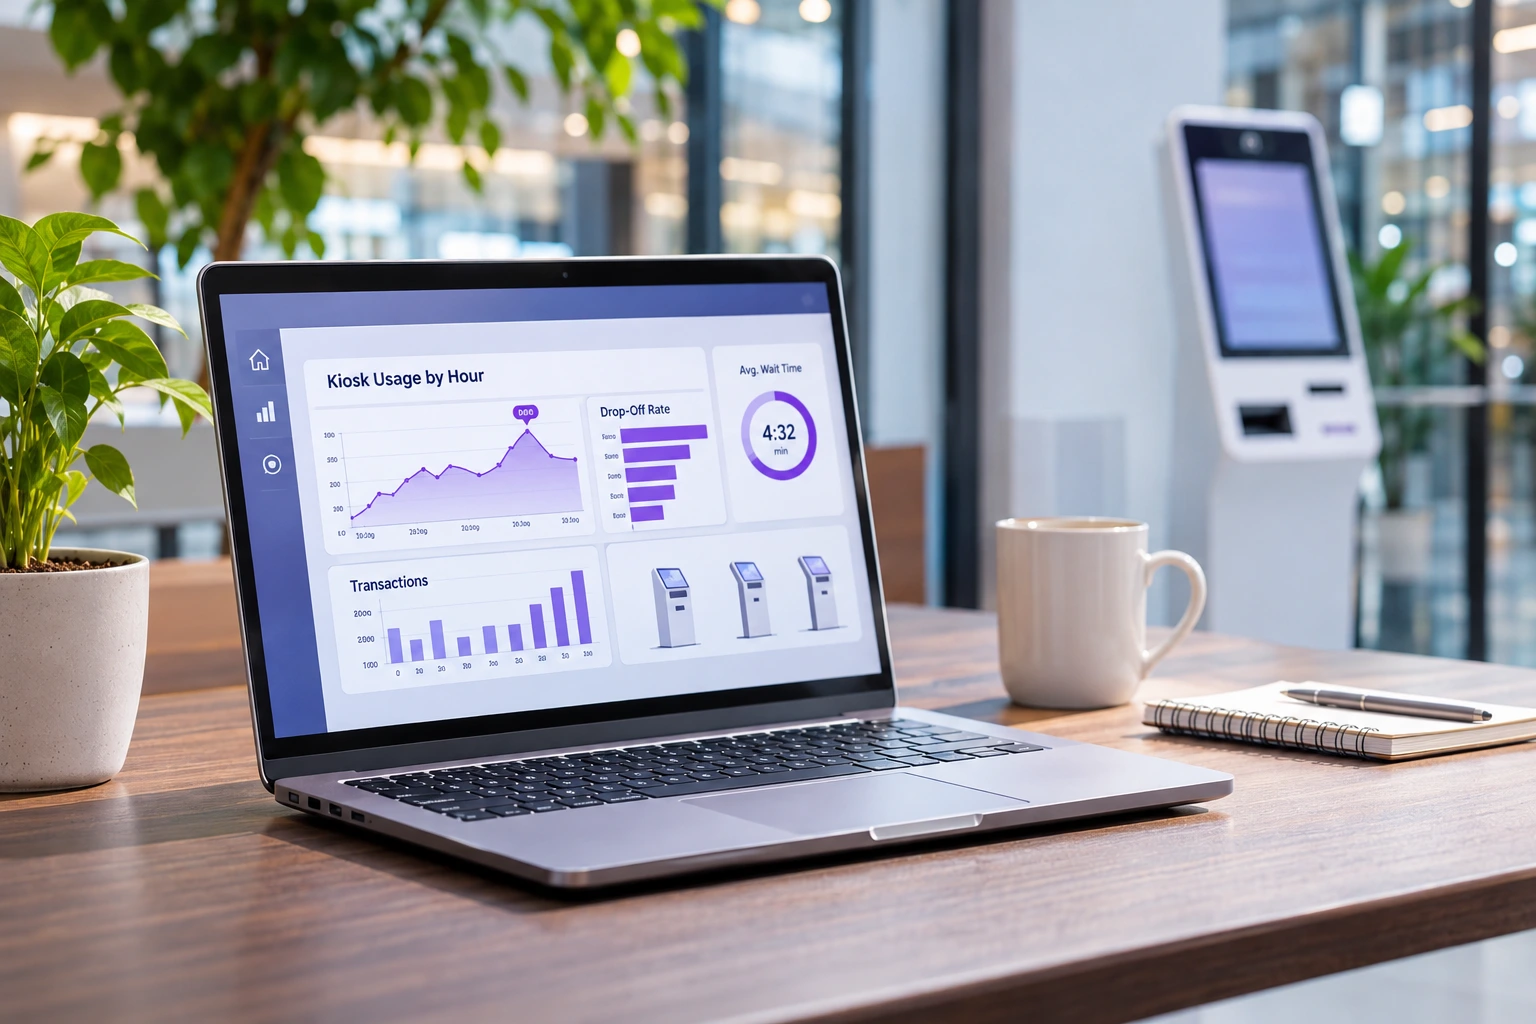
Most modern kiosk software sends this data to a central dashboard. From there, managers can view it by location, by hour or by device.
What is peak hour? When are your real peak hours?
In kiosk analytics, a peak hour is the time of day when a kiosk handles the most customer sessions or transactions. It’s measured from the timestamps the kiosk records each time someone starts or finishes a session.
A peak hour isn’t a fixed time. It changes by location, by day of the week and by season, such as Ramadan or the summer months.
You may think you already know your busiest hours. But do you really?
UAE footfall follows patterns that shift through the year. Ramadan pushes demand towards the hours before and after iftar. Summer heat moves mall traffic into the late evenings. The Saturday and Sunday weekend has reshaped weekly patterns too. And month-end salary dates bring a rush of their own.
Kiosk analytics replaces assumptions with timestamps. A burger outlet in Abu Dhabi might discover its lunch peak starts at 12.40, not 1.00. A government service centre might see a sharp spike on the first working day after a public holiday. Small insights like these change how you plan the whole day.
Here is what peak hour data helps you do.
- Offers a smarter way to schedule your staff - Put more people on the floor exactly when the dashboard indicates a climb in demand.
- Know how many kiosks you really need to operate – Based on the peak hour data, the businesses can install the number of kiosks a location actually needs. Too few - people queue at peak times. Too many and you’ve paid for units that mostly sit idle.
-
Time your promotions - Show combo offers on kiosk screens during slow hours to raise the value of each order. For example: during the 3 to 5 PM, the traffic usually drops. During that window the kiosk can show a special deal, such as “Coffee and cake for AED 15, 3 to 5 pm only,” and switch it off once the busy hours return.
You don’t need offers at peak hours because people are already coming in! - Plan kiosk maintenance – As you’ve got the peak hour data, the businesses can easily schedule software updating and servicing without affecting the operations.
Conducting a peak hour analysis helps teams to examine the kiosk usage data by time of day and day of week. It helps businesses to identify busiest periods and how the kiosk performs during the rush hours.
Peak hour analysis help teams gather certain insightful data, like:
- Transaction volume per hour - how many orders or sessions each kiosk handles in each time slot. (For example: 30 minutes or 60 minutes)
At what point do your customers drop off?
This is one of my favourite metrics.
A drop-off happens when a customer tarts a session but leaves before completing it. Kiosk analytics shows you the exact screen where that happens.
I have listed the usual suspects below.
- Crowded, complicated menus - Too many categories or detailing on the first screen can confuse first-time users.
- Language gaps – The UAE is home to residents from over 200 nationalities. Arabic and English may serve many customers, but not everyone.
- Payment failures – A declined card or a slow reader at the final step hurts the most.
- Early sign-up requests – Requesting for a customer phone number or Emirates ID at an early stage of interaction pushes people away.
- Slow screens – If a queue stands behind you, even a 2 second lag feels much longer, and can lead to drop-offs.
Here’s the interesting part. Most customers who abandon a session never complain. They simply walk away. Without session data, that lost revenue stays completely invisible.
Now, just think about fixing the screen lag. If your drop-off rate falls from 15% to 10%, every added completed order helps your business. No extra marketing effort or hiring additional staff!
Key metrics to remember
- Abandonment rate – the percentage of sessions started but not completed.
- Exit screen – the last screen viewed before a session ends without completing the transaction.
- Cart abandonment rate – the percentage of users who add items but leave before paying. The reasons include overly priced items, unusually long checkouts, or payment-related issues.
- Session timeout rate - sessions that end because the user stopped interacting with the kiosk for some reason.
- Payment failure rate - declined, timed-out, or failed transactions that force users to give up.
- Back navigation rate - Frequent back taps or repeated attempts indicate the users are lost or struggling mid-session.
What’s possible with the data?
There is so much to do with this wealth of data.
- Redesign problem screens - simplify the screens with high exit rates or long dwell times.
- Simplify the menu - reorganise confusing categories, reduce unwanted/excessive options, and add clear images and prices.
- Simplify the checkout - remove unnecessary steps, and make the “Pay” button more visible or clear to bring down cart abandonment.
- Fix payment related issues – Add additional payment modes, or work with payment providers to cut failures and timeouts.
- Review pricing and upsells - if users drop off at the cart, the teams can check whether surprise totals or pushy upsell prompts are driving them away.
- Fix technical issues - address screen lags, slow loading, or touch issues that frustrate users.
Wait times – How long are customers really waiting?
Self-service kiosk automation helps customers browse the kiosk screen, request the services they need or order items, and pay at their own pace, without waiting for staff. This improves the speed of transactions.
According to the statistics released by Restaurant Technology News, 76% of the kiosk-powered eateries were able to prevent wait times.
In the hospital emergency departments, the deployment of patient check-in kiosks has been known to reduce patient wait times.
So, why or when does the customer has to wait?
Let us consider the wait time involved in a restaurant or QSR setting.
- The customer arrives at the self-ordering kiosk.
- Selects a language, and browses the menu, picks his favourite dish.
- Performs customisation.
- Confirms the order and makes the payment pay by card, mobile wallet, QR code, or cash.
- The kiosk prints or displays an order number.
- The order goes straight to the kitchen, and the customer collects it when called or when it’s served at the table
Any issues, which includes screen lags, confusing information or categories, delayed payment processing, etc. can affect customer wait times.
Even staffing inefficiencies in the kitchen can prolong the food delivery time. This again adds to the wait time.
Key metrics to remember
- Session duration – the overall time the user interacts with the kiosk screen from the start of the session to its completion.
- Screen dwell time – how long the user stays on specific screens for payment processing, menu browsing, etc. Understanding the screen dwell time allows the technical team to know where the users slow or get stuck.
Screen dwell time metric helps to spot areas of friction, measure improvements, and reduce abandonment rates.
A long dwell time means something is wrong or confusing about the layout, or maybe unclear instructions, or too many detailing or options. All these factors lead to a confused or unhappy user.
Key metrics related to the QSR industry
- Order fulfilment time – the time from the order is paid at the kiosk to when the food reaches the customer.
- Kitchen ticket time - the time from when the order reaches the kitchen to when it’s marked ready.
Order fulfilment times give a hint to the customer satisfaction levels.
Whereas, the kitchen ticket times give the restaurant owners a hint to the kitchen’s staffing inefficiencies.
Self-service kiosk market size - UAE
According to the research conducted by Grand View Research, by 2030, UAE’s self-service kiosk market size is expected to reach USD 1224.5 million at a CAGR of 10.7%. The expected CAGR value of 10.7% is calculated for the period 2025-2030.
The chief driving factors are listed below.
- Digitalisation initiatives of the UAE government.
- Rising demand for self-service, contactless service.
- Automation in retail and restaurant sectors.
- Hospitality and tourism growth.
- Technological advancements like AI, biometric verification, etc.
- Rising demand for day-in and day-out service access points.
- Rising customer/passenger volumes.
- Government’s smart city initiatives.
To conclude
So, what can kiosk analytics really tell UAE businesses? Quite a lot, actually.
Peak hours, drop-offs and wait times are no longer mysteries. They are numbers on a dashboard, ready for action.
Put together, these numbers turn guesswork into clear, timely action. In a market where customers expect speed, every saved minute counts. Undoubtedly, businesses that read their kiosk data well will serve faster and sell more.
From design to deployment, Panashi delivers kiosk solutions that put real customer data in your hands.
Want to see what your kiosk data could reveal? Get in touch with our team today.
Frequently
Asked Questions
Yes, it can. Analytics shows how long customers spend at each kiosk and on each step. If one step takes too long, you can simplify it. If queues build at certain hours, you can add kiosks or redirect customers. And shorter waits mean happier customers and fewer walk-aways.
Any business with high footfall and repeat transactions can benefit. Quick-service restaurants, retail, healthcare, hospitality and government services see the clearest gains. For example: think of a busy food court in a Dubai mall or a theme park ticketing counter.
Yes, it does. Panashi’s kiosk solutions come with analytics that show how customers use each kiosk. You can track peak hours, transaction volumes, drop-off points and average wait times. Remote monitoring also alerts your team to hardware issues before they turn into downtime.
Yes, indeed. With a centralised dashboard, your team can compare performance across branches in Dubai, Abu Dhabi or Sharjah or any other Emirate from a single screen.
Yes, the Panashi team walks your staff through the dashboard after deployment. They show your team how to read reports, set alerts and act on the insights.